Available courses

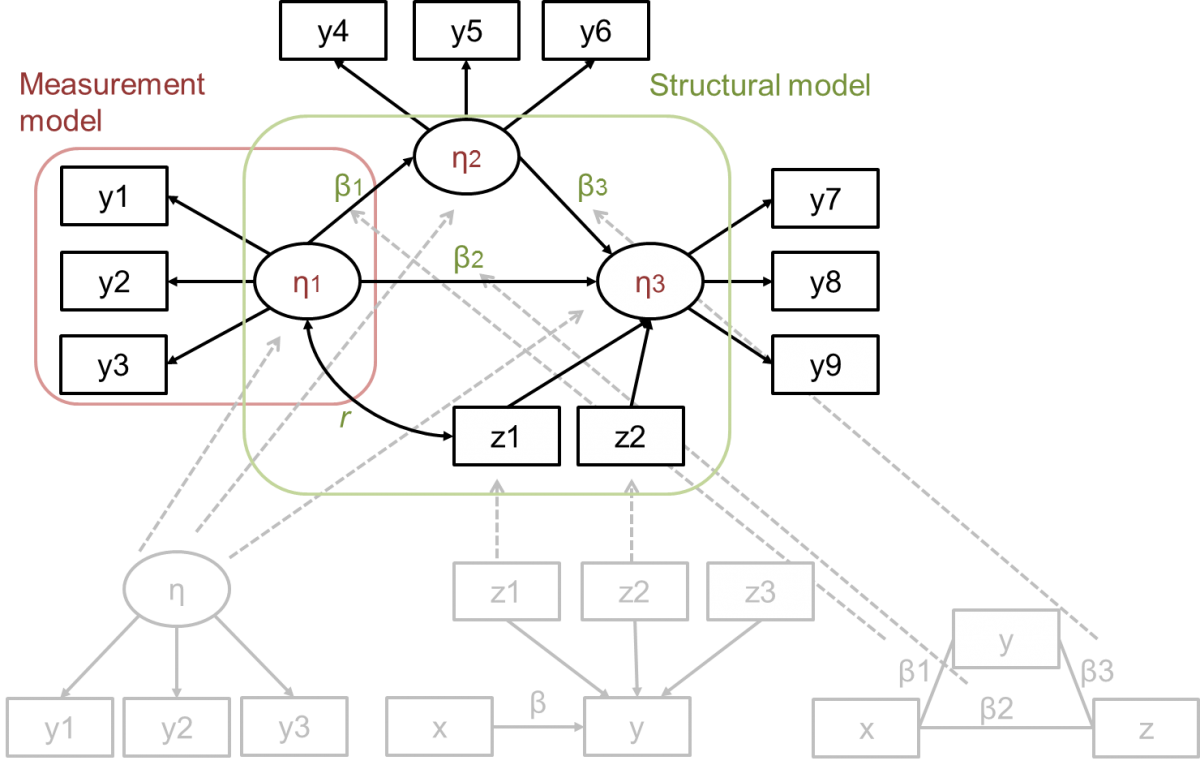
This course is designed as an applied introduction to the use of both AMOS and Mplus software packages for estimating basic structural equation models.


(N.B. Although the instructor will teach and use both packages throughout the course, students are free to use either both packages or they may choose to just work with one of the packages.)


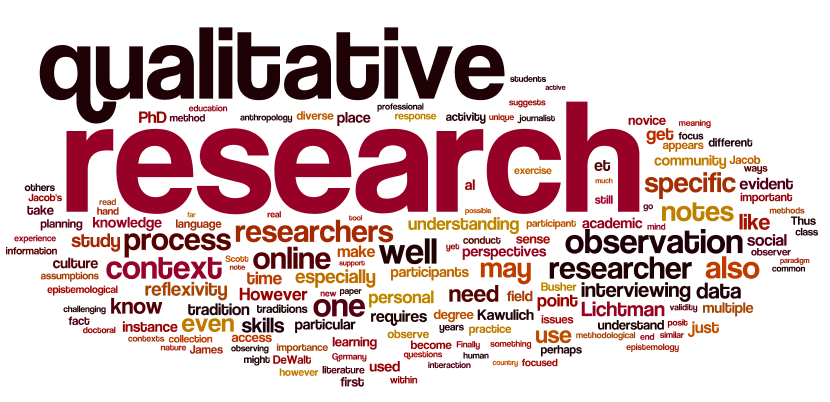
This is an introductory course designed for the individual with limited or no previous experience with qualitative techniques of data collection and analysis.

This course provides an overview of Longitudinal Data Analysis. As well as the statistical theory, an overview of the many applications and capabilities of LDA is given.

This course is designed as an introductory course for applied researchers and as such, is suitable for participants who want to develop a fundamental knowledge of LDA techniques.


This course is designed for participants who have undertaken a qualitative study in their work or study and would like to build their theoretical knowledge and applied skill base in qualitative research.

This course aims to provide you with the understanding and experience to undertake a basic research project in the social or health sciences using Stata as the statistical tool.

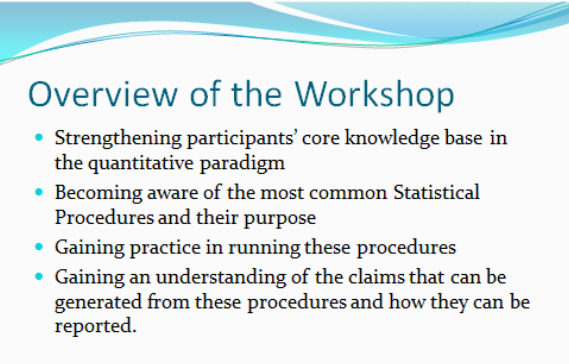
This is an intermediate, applied course covering a range of the most commonly used statistical procedures. It aims to provide participants with an ability to understand, run and interpret these procedures.This course will further enhance your ability to understand research based literature where these procedures were employed.

This course covers data collection and research design, visualisation and basic analytic methods used in social network research. It is designed for mixed methods and qualitative researchers.

This course is intended for applied data analysts, including academics and postgraduate students, policy specialists and others. It will examine questions dealt with in public policy, the social sciences and industry, using real data. This includes surveys, and economics and public health data. The unit will help build participants’ ability to undertake rigorous statistical analysis, including means, confidence intervals and linear regression in R, and create publication-standard graphs of the results. The end result will be more professional and easy to understand research. It provides the foundational skills needed for the ACSPRI course Advanced Statistical Analysis using R.

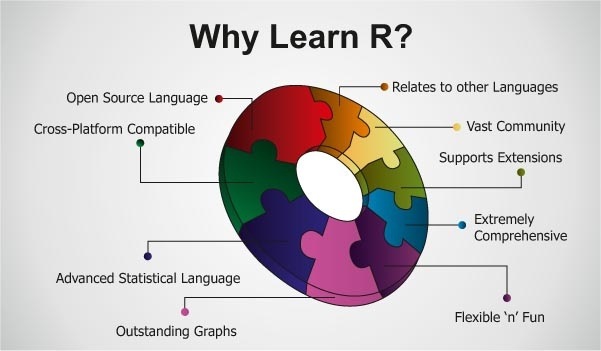
This course is a step by step interactive introduction for participants with no experience with R and RStudio. Notes will be provided and a set of exercises, covering a variety of data sets, will be run together during the lecture and also individually at the end of the day. The course content is particularly suited for those involved in research in the business, education, social and health sciences.


Participants will first be introduced to the foundations of R such as libraries, matrix manipulation, objects, and data frames. Participants will use R Markdown in RStudio to generate reports, tables and graphics to Word, PDF and HTML files. Once the foundations have been covered a variety of data management skills will introduced (e.g. filtering data, merging data). The production of descriptive statistics tables and graphs will be covered so that participants can easily use RStudio to explore data and produce reports.


The last session on each day will finish with a set of exercises for participants to run on their own and practice what they have learned that day. Please note that due to the short 2-day structure, there will not be any time set aside for analysing participant’s own data.


Machie Learning techniques are becoming increasingly popular across areas of research from computer science to various disciplines of medicine. This branch of artificial intelligence relates to algorithms that learn from data based on specific tasks and performance measures. This course is an introductory applied course, using Stata software to run various ML algorithms. This course will use some Stata commands that are built into the base system and others that have been specially designed user-written commands that have evolved from the increasing use of ML. Classification, prediction and model selection issues will be discussed. Detailed notes with worked examples and references will be provided as a basis for both the lecture and hands-on computing aspect of the course.

Please note that this course will use Stata V16.


This course is a step by step interactive introduction for participants with no experience with R and RStudio. Notes will be provided and a set of exercises, covering a variety of data sets, will be run together during the lecture and also individually at the end of the day. The course content is particularly suited for those involved in research in the business, education, social and health sciences.


Participants will first be introduced to the foundations of R such as libraries, matrix manipulation, objects, and data frames. Participants will use R Markdown in RStudio to generate reports, tables and graphics to Word, PDF and HTML files. Once the foundations have been covered a variety of data management skills will introduced (e.g. filtering data, merging data). The production of descriptive statistics tables and graphs will be covered so that participants can easily use RStudio to explore data and produce reports.


The last session on each day will finish with a set of exercises for participants to run on their own and practice what they have learned that day. Please note that due to the short 2-day structure, there will not be any time set aside for analysing participant’s own data.


The course assumes no prior skills with using NVivo, however will cater for all levels of participants, from novice to advanced users. The focus is on developing the essentials skills from NVivo through hands-on experience. Sample data will be provided, however those with their own data will be accomodated and encouraged to advance their 'real' projects.


This training will be conducted using the Windows platform software only. NVivo for Mac are welcome, but must be aware that all demonstrations will be provided in Windows. This course will be run using NVivo version 12. Participants will be expected to have NVivo installed on their own device.


Having software that is free of cost is an easy sell, but source code freedom has many other advantages: self hosting ability, full control of data and privacy, and the ability to modify the software to suit your needs to name a few.

The workshop will include the installation of a suite of free and open source software tools for conducting surveys in multiple modes on your own device, then run through the use of these tools. The core tool is LimeSurvey, a powerful and free web based survey tool, which acts as a questionnaire authoring and web based data collection tool. Also demonstrated will be the Android Offline Surveys app for CAPI, queXS* for CATI and queXF* for PAPI data entry.

*Disclosure: queXS and queXF are developed by the author of this presentation.

Course objectives and planned hands-on activities:

– What is free / open source software and why does it matter
– Obtaining and installing the software (please bring a laptop, otherwise you can watch as a demonstration)
– Setting up a “base” questionnaire in LimeSurvey
– Using the suite of tools to deliver the questionnaire in multiple modes (CAPI, CATI, CAWI, PAPI)
– Limitations of the tools

The workshop consists mainly of hands-on activities, including the installation and use of the tools, followed by a Q&A session.

Designed for the applied users of R, this master-class will show you how to access spatial data from a number of sources, match this with geographic shape files, analyse spatial patterns, link these data to information from surveys, and create interactive maps to highlight important findings.


This course will be run over 2 days in three sessions per day:

  • 9.30 am - 11.30 am - Session 1
  • 12.00 pm - 1.30 pm - Session 2
  • 2.30 pm - 4.30 pm - Session 3


This course is being held online via Zoom and run on Australian Eastern Standard Time (GMT +10)


Machine Learning techniques are becoming increasingly popular across areas of research from computer science to various disciplines of medicine. This branch of artificial intelligence relates to algorithms that learn from data based on specific tasks and performance measures. This course is an introductory applied course, with exercises in R and Python to run various ML algorithms.

Classification, prediction and model selection issues will be discussed. Detailed notes with worked examples and references will be provided as a basis for both the lecture and hands-on computing aspect of the course.

This course primarily focuses on the application of specific ML techniques rather than the complex mathematics behind the ML algorithms and discussion of some of the uses in ML techniques in publications will be discussed at the end of the course.


This course is a step by step interactive introduction for participants with no experience with R and RStudio. Notes will be provided and a set of exercises, covering a variety of data sets, will be run together during the lecture and also individually at the end of the day. The course content is particularly suited for those involved in research in the business, education, social and health sciences.


Participants will first be introduced to the foundations of R such as libraries, matrix manipulation, objects, and data frames. Participants will use R Markdown in RStudio to generate reports, tables and graphics to Word, PDF and HTML files. Once the foundations have been covered a variety of data management skills will introduced (e.g. filtering data, merging data). The production of descriptive statistics tables and graphs will be covered so that participants can easily use RStudio to explore data and produce reports.


The last session on each day will finish with a set of exercises for participants to run on their own and practice what they have learned that day. Please note that due to the short 2-day structure, there will not be any time set aside for analysing participant’s own data.


Designed for the applied users of R, this master-class will show you how to access spatial data from a number of sources, match this with geographic shape files, analyse spatial patterns, link these data to information from surveys, and create interactive maps to highlight important findings.


This course will be run over 2 days in three sessions per day:

  • 9.30 am - 11.30 am - Session 1
  • 12.00 pm - 1.30 pm - Session 2
  • 2.30 pm - 4.30 pm - Session 3


This course is being held online via Zoom and run on Australian Eastern Standard Time (GMT +10)


We are in the middle of a data revolution. Research and decision-making in the private, not for profit and public sectors is not immune from its effects. Modern policy research in particular has become increasingly data driven.

High quality data collection is a significant part of this, and the use of survey-type instruments, from the Census to polling, has become increasingly important. However, there have been some large public failures in recent years. Why have there been problems with the Census, how have surveys gotten some recent elections so wrong, and how can they be effectively used to collect data for research, target campaigns and messaging, or design policy?

Taught by instructors with real-world experience as campaign consultants, survey researchers and data scientists, this masterclass will focus on teaching you about survey design. You will be shown how political survey research works, and sometimes doesn’t, how technology and social trends are changing survey research, and the best ways to write effective survey questions. It will provide you with the knowledge and skills to develop the survey instruments needed for data-driven decision making and advice. It is also designed to help provide an understanding of how large survey projects are run for political campaigns and academic studies.


This master-class provides a foundation for those wishing to utilise structural equation modelling (SEM) to explore and test complex relationships.

The course is designed as an applied introduction to SEM using Stata, aimed at providing participants with a sound understanding of when to use SEM and how to assess and report their models.

We are in the middle of a data revolution. Research and decision-making in the private, not for profit and public sectors is not immune from its effects. Modern policy research in particular has become increasingly data driven.

High quality data collection is a significant part of this, and the use of survey-type instruments, from the Census to polling, has become increasingly important. However, there have been some large public failures in recent years. Why have there been problems with the Census, how have surveys gotten some recent elections so wrong, and how can they be effectively used to collect data for research, target campaigns and messaging, or design policy?

Taught by instructors with real-world experience as campaign consultants, survey researchers and data scientists, this masterclass will focus on teaching you about survey design. You will be shown how political survey research works, and sometimes doesn’t, how technology and social trends are changing survey research, and the best ways to write effective survey questions. It will provide you with the knowledge and skills to develop the survey instruments needed for data-driven decision making and advice. It is also designed to help provide an understanding of how large survey projects are run for political campaigns and academic studies.


This course is designed as an introduction to mixed effects modelling. These models involve data arising from longitudinal studies or studies where the data exhibits some form of hierarchy, and sometimes referred to as multilevel modelling.


Mixed effects modelling is used when observations are not independent of each other (e.g., clustered data, repeated measures). This type of analysis is regularly used in such areas as educational research when studying the performance of students within schools and in medical research when investigating the outcomes over time following major trauma.


Mixed effects refer to the inclusion of both fixed effects (i.e., the variables that are constant across individuals) and random effects (i.e., account for variability among subjects around the relationships captured by the fixed effects).


This course will be discussing the linear mixed effects models in which the outcome of interest is continuous. Discussion of some of the uses of mixed effects models in publications will be discussed at the end of the course.

Machine Learning techniques are becoming increasingly popular across areas of research from computer science to various disciplines of medicine. This branch of artificial intelligence relates to algorithms that learn from data based on specific tasks and performance measures. This course is an introductory applied course, with exercises in R and Python to run various ML algorithms.

Classification, prediction and model selection issues will be discussed. Detailed notes with worked examples and references will be provided as a basis for both the lecture and hands-on computing aspect of the course.

This course primarily focuses on the application of specific ML techniques rather than the complex mathematics behind the ML algorithms and discussion of some of the uses in ML techniques in publications will be discussed at the end of the course.


We are in the middle of a data revolution. Research and decision-making in the private, not for profit and public sectors is not immune from its effects. Modern policy research in particular has become increasingly data driven.

High quality data collection is a significant part of this, and the use of survey-type instruments, from the Census to polling, has become increasingly important. However, there have been some large public failures in recent years. Why have there been problems with the Census, how have surveys gotten some recent elections so wrong, and how can they be effectively used to collect data for research, target campaigns and messaging, or design policy?

Taught by instructors with real-world experience as campaign consultants, survey researchers and data scientists, this masterclass will focus on teaching you about survey design. You will be shown how political survey research works, and sometimes doesn’t, how technology and social trends are changing survey research, and the best ways to write effective survey questions. It will provide you with the knowledge and skills to develop the survey instruments needed for data-driven decision making and advice. It is also designed to help provide an understanding of how large survey projects are run for political campaigns and academic studies.


This course is designed as an introduction to mixed effects modelling. These models involve data arising from longitudinal studies or studies where the data exhibits some form of hierarchy, and sometimes referred to as multilevel modelling.


Mixed effects modelling is used when observations are not independent of each other (e.g., clustered data, repeated measures). This type of analysis is regularly used in such areas as educational research when studying the performance of students within schools and in medical research when investigating the outcomes over time following major trauma.


Mixed effects refer to the inclusion of both fixed effects (i.e., the variables that are constant across individuals) and random effects (i.e., account for variability among subjects around the relationships captured by the fixed effects).


This course will be discussing the linear mixed effects models in which the outcome of interest is continuous. Discussion of some of the uses of mixed effects models in publications will be discussed at the end of the course.

Designed for the applied users of R, this master-class will show you how to access spatial data from a number of sources, match this with geographic shape files, analyse spatial patterns, link these data to information from surveys, and create interactive maps to highlight important findings.


This course will be run over 2 days in three sessions per day:

  • 9.30 am - 11.30 am - Session 1
  • 12.00 pm - 1.30 pm - Session 2
  • 2.30 pm - 4.30 pm - Session 3


This course is being held online via Zoom and run on Australian Eastern Standard Time (GMT +10)


This master-class provides a foundation for those wishing to utilise structural equation modelling (SEM) to explore and test complex relationships.

The course is designed as an applied introduction to SEM using Stata, aimed at providing participants with a sound understanding of when to use SEM and how to assess and report their models.

This master-class introduces participants to approaches for collecting and analysing network and text data from social media, with a focus on Twitter, YouTube and Reddit.

The main software used in the course is R, but we also introduce Gephi for advanced visualisation. Data collection is via the VOSON Dashboard and vosonSML R packages for collecting social media network and data. We also cover other important R packages for network and text analysis such as: igraph (network analysis and visualisation), quanteda (quantitative analysis of textual data), tidytext and tm (text mining), wordcloud (text word clouds).

The course will be particularly useful to academics and PhD students who want to become more computationally literate, and those from technical disciplines (e.g. computer science, engineering, information science) who want to become more familiar with social science approaches to big data research. The course will also be useful for people from industry and government whose work involves quantitative analysis of social media data, e.g. for marketing, social research, public relations, brand management, journalism, opinion analysis.


This course is intended for applied data analysts, including academics and postgraduate students, policy specialists and others. It will examine questions dealt with in public policy, the social sciences and industry, using real data. This includes surveys, and economics and public health data. The unit will help build participants’ ability to undertake rigorous statistical analysis, including means, confidence intervals and linear regression in R, and create publication-standard graphs of the results. The end result will be more professional and easy to understand research. It provides the foundational skills needed for the ACSPRI two-day masterclass Spatial Analysis in R: Online, and the week-long course Advanced Statistical Analysis using R.

This is an introductory unit in statistical methods with the emphasis on statistical techniques applicable to the social sciences, although these introductory techniques are also relevant to the health sciences.

This is an introductory unit in statistical methods with the emphasis on statistical techniques applicable to the social sciences, although these introductory techniques are also relevant to the health sciences.

This course aims to provide you with the understanding and experience to undertake a basic research project in the social or health sciences using Stata as the statistical tool.

This course is intended for applied data analysts, including academics and postgraduate students, policy specialists and others. It will examine questions dealt with in public policy, the social sciences and industry, using real data. This includes surveys, and economics and public health data. The unit will help build participants’ ability to undertake rigorous statistical analysis, including means, confidence intervals and linear regression in R, and create publication-standard graphs of the results. The end result will be more professional and easy to understand research. It provides the foundational skills needed for the ACSPRI two-day masterclass Spatial Analysis in R: Online, and the week-long course Advanced Statistical Analysis using R.

In this course you will learn about all elements of the qualitative research process and how they are interrelated. We will unpack the key components of qualitative research design, including the stances and theories that underpin qualitative methodologies, as well as techniques of data collection and analysis. We pay particular attention to what’s involved in ethically employing popular methods such as interviewing and observation. The course combines lectures covering foundational issues with practical workshops that give you a chance to practice qualitative techniques first-hand.


The target audience for this course is those who would like to become more familiar with qualitative research techniques, from postgraduate university students and staff to researchers in government and private organisations.


This master-class introduces participants to approaches for collecting and analysing network and text data from social media, with a focus on Twitter, YouTube and Reddit.

The main software used in the course is R, but we also introduce Gephi for advanced visualisation. Data collection is via the VOSON Dashboard and vosonSML R packages for collecting social media network and data. We also cover other important R packages for network and text analysis such as: igraph (network analysis and visualisation), quanteda (quantitative analysis of textual data), tidytext and tm (text mining), wordcloud (text word clouds).

The course will be particularly useful to academics and PhD students who want to become more computationally literate, and those from technical disciplines (e.g. computer science, engineering, information science) who want to become more familiar with social science approaches to big data research. The course will also be useful for people from industry and government whose work involves quantitative analysis of social media data, e.g. for marketing, social research, public relations, brand management, journalism, opinion analysis.


In this course you will learn about all elements of the qualitative research process and how they are interrelated. We will unpack the key components of qualitative research design, including the stances and theories that underpin qualitative methodologies, as well as techniques of data collection and analysis. We pay particular attention to what’s involved in ethically employing popular methods such as interviewing and observation. The course combines lectures covering foundational issues with practical workshops that give you a chance to practice qualitative techniques first-hand.


The target audience for this course is those who would like to become more familiar with qualitative research techniques, from postgraduate university students and staff to researchers in government and private organisations.


This course aims to provide you with the understanding and experience to undertake a basic research project in the social or health sciences using Stata as the statistical tool.

This course is intended for applied data analysts, including academics and postgraduate students, policy specialists and others. It will examine questions dealt with in public policy, the social sciences and industry, using real data. This includes surveys, and economics and public health data. The unit will help build participants’ ability to undertake rigorous statistical analysis, including means, confidence intervals and linear regression in R, and create publication-standard graphs of the results. The end result will be more professional and easy to understand research. It provides the foundational skills needed for the ACSPRI two-day masterclass Spatial Analysis in R: Online, and the week-long course Advanced Statistical Analysis using R.

This master-class introduces participants to approaches for collecting and analysing network and text data from social media, with a focus on Twitter, YouTube and Reddit.

The main software used in the course is R, but we also introduce Gephi for advanced visualisation. Data collection is via the VOSON Dashboard and vosonSML R packages for collecting social media network and data. We also cover other important R packages for network and text analysis such as: igraph (network analysis and visualisation), quanteda (quantitative analysis of textual data), tidytext and tm (text mining), wordcloud (text word clouds).

The course will be particularly useful to academics and PhD students who want to become more computationally literate, and those from technical disciplines (e.g. computer science, engineering, information science) who want to become more familiar with social science approaches to big data research. The course will also be useful for people from industry and government whose work involves quantitative analysis of social media data, e.g. for marketing, social research, public relations, brand management, journalism, opinion analysis.


In this course you will learn about all elements of the qualitative research process and how they are interrelated. We will unpack the key components of qualitative research design, including the stances and theories that underpin qualitative methodologies, as well as techniques of data collection and analysis. We pay particular attention to what’s involved in ethically employing popular methods such as interviewing and observation. The course combines lectures covering foundational issues with practical workshops that give you a chance to practice qualitative techniques first-hand.


The target audience for this course is those who would like to become more familiar with qualitative research techniques, from postgraduate university students and staff to researchers in government and private organisations.


This is an introductory unit in statistical methods with the emphasis on statistical techniques applicable to the social sciences, although these introductory techniques are also relevant to the health sciences.

This course is intended for applied data analysts, including academics and postgraduate students, policy specialists and others. It will examine questions dealt with in public policy, the social sciences and industry, using real data. This includes surveys, and economics and public health data. The unit will help build participants’ ability to undertake rigorous statistical analysis, including means, confidence intervals and linear regression in R, and create publication-standard graphs of the results. The end result will be more professional and easy to understand research. It provides the foundational skills needed for the ACSPRI two-day masterclass Spatial Analysis in R: Online, and the week-long course Advanced Statistical Analysis using R.

This course aims to provide you with the understanding and experience to undertake a basic research project in the social or health sciences using Stata as the statistical tool.

In this course you will learn about all elements of the qualitative research process and how they are interrelated. We will unpack the key components of qualitative research design, including the stances and theories that underpin qualitative methodologies, as well as techniques of data collection and analysis. We pay particular attention to what’s involved in ethically employing popular methods such as interviewing and observation. The course combines lectures covering foundational issues with practical workshops that give you a chance to practice qualitative techniques first-hand.


The target audience for this course is those who would like to become more familiar with qualitative research techniques, from postgraduate university students and staff to researchers in government and private organisations.


This is an introductory unit in statistical methods with the emphasis on statistical techniques applicable to the social sciences, although these introductory techniques are also relevant to the health sciences.

This is an introductory unit in statistical methods with the emphasis on statistical techniques applicable to the social sciences, although these introductory techniques are also relevant to the health sciences.

In this course you will learn about all elements of the qualitative research process and how they are interrelated. We will unpack the key components of qualitative research design, including the stances and theories that underpin qualitative methodologies, as well as techniques of data collection and analysis. We pay particular attention to what’s involved in ethically employing popular methods such as interviewing and observation. The course combines lectures covering foundational issues with practical workshops that give you a chance to practice qualitative techniques first-hand.


The target audience for this course is those who would like to become more familiar with qualitative research techniques, from postgraduate university students and staff to researchers in government and private organisations.


This course aims to provide you with the understanding and experience to undertake a basic research project in the social or health sciences using Stata as the statistical tool.

This course is intended for applied data analysts, including academics and postgraduate students, policy specialists and others. It will examine questions dealt with in public policy, the social sciences and industry, using real data. This includes surveys, and economics and public health data. The unit will help build participants’ ability to undertake rigorous statistical analysis, including means, confidence intervals and linear regression in R, and create publication-standard graphs of the results. The end result will be more professional and easy to understand research. It provides the foundational skills needed for the ACSPRI two-day masterclass Spatial Analysis in R: Online, and the week-long course Advanced Statistical Analysis using R.

This is an introductory unit in statistical methods with the emphasis on statistical techniques applicable to the social sciences, although these introductory techniques are also relevant to the health sciences.

This master-class introduces participants to approaches for collecting and analysing network and text data from social media, with a focus on Twitter, YouTube and Reddit.

The main software used in the course is R, but we also introduce Gephi for advanced visualisation. Data collection is via the VOSON Dashboard and vosonSML R packages for collecting social media network and data. We also cover other important R packages for network and text analysis such as: igraph (network analysis and visualisation), quanteda (quantitative analysis of textual data), tidytext and tm (text mining), wordcloud (text word clouds).

The course will be particularly useful to academics and PhD students who want to become more computationally literate, and those from technical disciplines (e.g. computer science, engineering, information science) who want to become more familiar with social science approaches to big data research. The course will also be useful for people from industry and government whose work involves quantitative analysis of social media data, e.g. for marketing, social research, public relations, brand management, journalism, opinion analysis.


This is an introductory unit in statistical methods with the emphasis on statistical techniques applicable to the social sciences, although these introductory techniques are also relevant to the health sciences.

This course is intended for applied data analysts, including academics and postgraduate students, policy specialists and others. It will examine questions dealt with in public policy, the social sciences and industry, using real data. This includes surveys, and economics and public health data. The unit will help build participants’ ability to undertake rigorous statistical analysis, including means, confidence intervals and linear regression in R, and create publication-standard graphs of the results. The end result will be more professional and easy to understand research. It provides the foundational skills needed for the ACSPRI two-day masterclass Spatial Analysis in R: Online, and the week-long course Advanced Statistical Analysis using R.

This course aims to provide you with the understanding and experience to undertake a basic research project in the social or health sciences using Stata as the statistical tool.

This course is a step by step interactive introduction for participants with no experience with R and RStudio. Notes will be provided and a set of exercises, covering a variety of data sets, will be run together during the lecture and also individually at the end of the day. The course content is particularly suited for those involved in research in the business, education, social and health sciences.


Participants will first be introduced to the foundations of R such as libraries, matrix manipulation, objects, and data frames. Participants will use R Markdown in RStudio to generate reports, tables and graphics to Word, PDF and HTML files. Once the foundations have been covered a variety of data management skills will introduced (e.g. filtering data, merging data). The production of descriptive statistics tables and graphs will be covered so that participants can easily use RStudio to explore data and produce reports.


The last session on each day will finish with a set of exercises for participants to run on their own and practice what they have learned that day. Please note that due to the short 2-day structure, there will not be any time set aside for analysing participant’s own data.


In this course you will learn about all elements of the qualitative research process and how they are interrelated. We will unpack the key components of qualitative research design, including the stances and theories that underpin qualitative methodologies, as well as techniques of data collection and analysis. We pay particular attention to what’s involved in ethically employing popular methods such as interviewing and observation. The course combines lectures covering foundational issues with practical workshops that give you a chance to practice qualitative techniques first-hand.


The target audience for this course is those who would like to become more familiar with qualitative research techniques, from postgraduate university students and staff to researchers in government and private organisations.


This is an introductory unit in statistical methods with the emphasis on statistical techniques applicable to the social sciences, although these introductory techniques are also relevant to the health sciences.

In this course you will learn about all elements of the qualitative research process and how they are interrelated. We will unpack the key components of qualitative research design, including the stances and theories that underpin qualitative methodologies, as well as techniques of data collection and analysis. We pay particular attention to what’s involved in ethically employing popular methods such as interviewing and observation. The course combines lectures covering foundational issues with practical workshops that give you a chance to practice qualitative techniques first-hand.


The target audience for this course is those who would like to become more familiar with qualitative research techniques, from postgraduate university students and staff to researchers in government and private organisations.


This course aims to provide you with the understanding and experience to undertake a basic research project in the social or health sciences using Stata as the statistical tool.

This is an introductory unit in statistical methods with the emphasis on statistical techniques applicable to the social sciences, although these introductory techniques are also relevant to the health sciences.

This is an introductory unit in statistical methods with the emphasis on statistical techniques applicable to the social sciences, although these introductory techniques are also relevant to the health sciences.

This master-class introduces participants to approaches for collecting and analysing network and text data from social media, with a focus on Twitter, YouTube and Reddit.

The main software used in the course is R, but we also introduce Gephi for advanced visualisation. Data collection is via the VOSON Dashboard and vosonSML R packages for collecting social media network and data. We also cover other important R packages for network and text analysis such as: igraph (network analysis and visualisation), quanteda (quantitative analysis of textual data), tidytext and tm (text mining), wordcloud (text word clouds).

The course will be particularly useful to academics and PhD students who want to become more computationally literate, and those from technical disciplines (e.g. computer science, engineering, information science) who want to become more familiar with social science approaches to big data research. The course will also be useful for people from industry and government whose work involves quantitative analysis of social media data, e.g. for marketing, social research, public relations, brand management, journalism, opinion analysis.


This course is intended for applied data analysts, including academics and postgraduate students, policy specialists and others. It will examine questions dealt with in public policy, the social sciences and industry, using real data. This includes surveys, and economics and public health data. The unit will help build participants’ ability to undertake rigorous statistical analysis, including means, confidence intervals and linear regression in R, and create publication-standard graphs of the results. The end result will be more professional and easy to understand research. It provides the foundational skills needed for the ACSPRI two-day masterclass Spatial Analysis in R: Online, and the week-long course Advanced Statistical Analysis using R.

In this course you will learn about all elements of the qualitative research process and how they are interrelated. We will unpack the key components of qualitative research design, including the stances and theories that underpin qualitative methodologies, as well as techniques of data collection and analysis. We pay particular attention to what’s involved in ethically employing popular methods such as interviewing and observation. The course combines lectures covering foundational issues with practical workshops that give you a chance to practice qualitative techniques first-hand.


The target audience for this course is those who would like to become more familiar with qualitative research techniques, from postgraduate university students and staff to researchers in government and private organisations.


This course aims to provide you with the understanding and experience to undertake a basic research project in the social or health sciences using Stata as the statistical tool.

This is an introductory unit in statistical methods with the emphasis on statistical techniques applicable to the social sciences, although these introductory techniques are also relevant to the health sciences.

This is an introductory unit in statistical methods with the emphasis on statistical techniques applicable to the social sciences, although these introductory techniques are also relevant to the health sciences.

This course aims to provide you with the understanding and experience to undertake a basic research project in the social or health sciences using Stata as the statistical tool.

This is an introductory unit in statistical methods with the emphasis on statistical techniques applicable to the social sciences, although these introductory techniques are also relevant to the health sciences.